
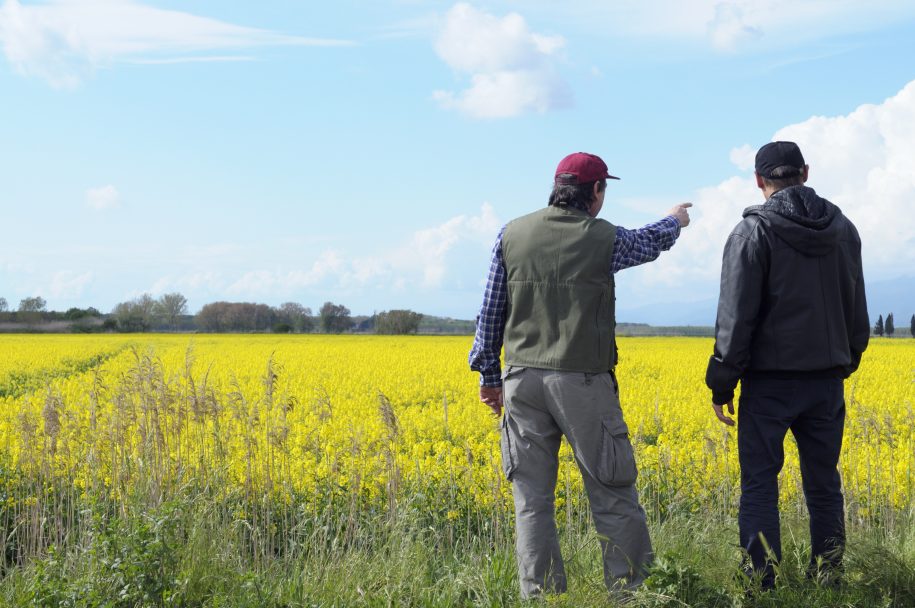
You can’t circle June 15 and expect your canola to be at early flower that day. A warm May pushes a crop ahead, and a cool one holds it back. When fungicide timing, insect scouting and harvest planning hang on stages that can come days early or late, the calendar is a poor guide.
Growing degree days (GDD) are how agronomists track where a crop or pest actually is in its development. We asked Guy Ash, Director of Technical Sales at TerraVision360, to explain how they work, how to make them more precise, and how to use them to get ahead of the decisions that matter.
What growing degree days measure
GDD measure the heat a living thing has accumulated over time. Crops and insects both need warmth to develop, and below a certain temperature, called the base threshold, development essentially stops.
“Many things don’t just grow based on a calendar,” Guy says. “The year could be very warm early on, the crop starts developing earlier, and it reaches a stage earlier than the calendar date.”
The basic calculation leaves some things out, such as solar energy and day length (photoperiod). But heat is the main driver of development, so a running GDD total tracks progress toward each stage far better than the date does.
How the basic calculation works
For each day, take the average of the maximum and minimum temperatures, then subtract the base threshold:
Say your canola field sees a high of 30°C and a low of 10°C. The average is 20°C. Canola uses a base of 5°C, so that day adds 15 GDD. Add up each day’s total from seeding, and the running total tells you how far along the crop is.
Different crops and pests use different bases
The base threshold depends on what you’re tracking. Canola uses 5°C. Wheat and similar cereals use something in the 0-4°C range. Corn, a heat-loving crop, uses 10°C. Some insect models use a base as high as 15°C.
Making the model more precise
The simple formula is a starting point. More refined models add limits and extra factors.
Some set an upper cap as well as a base. For corn, a common approach counts development only between 10°C and 30°C, because heat above 30°C doesn’t speed the crop up. Others use three temperatures: a minimum, an optimum and a maximum.
Some also account for day length. Soybeans, for example, are sensitive to photoperiod in their reproductive stages, so a good soybean model factors that in. “They become very accurate when you start to include not just the base number, but optimum and upper-end temperatures,” Guy says.
Measure where the pest actually lives
GDD don’t have to come from air temperature. An insect that develops in the soil responds to soil temperature, so that’s the better input. The closer your sensor is to what the crop or pest experiences, the more accurate the model. A field station with an air temperature sensor and a soil probe gives you data from your own field, not a town 40 km away.
Looking ahead with the forecast
GDD up to today tell you where you are. Adding a site-specific hourly forecast tells you where you’ll be.
That turns GDD into an early warning. If the forecast shows wheat midge emergence about five days out, you know when to have boots on the ground. If early flower in canola is coming, you have time to line up product, sprayer and operator before the window opens.
How to track crop stage by field in TerraVision360
Here’s how the GDD and crop staging view works for a canola field.
- Set up the field. Import or draw the field boundary, then enter the crop, variety and seeding date. TerraVision360 has a regional estimate for your seeding date, but providing your own seeding date results in a much more accurate staging timeline.
- Open the crop staging view. The field shows accumulated GDD (base 5°C for canola) on a timeline, with each growth stage marked.
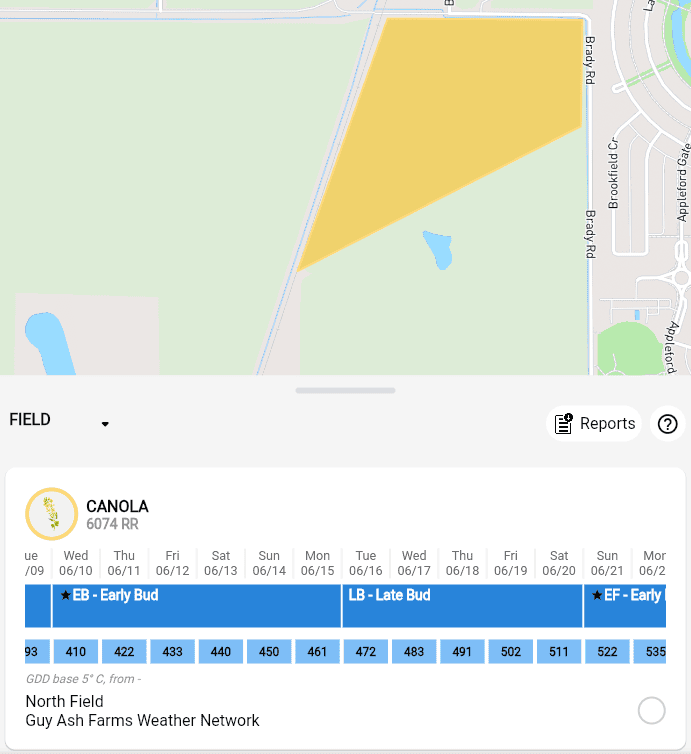
- Read the stage thresholds. In Guy’s “North Field” canola test plot south of Winnipeg, the timeline marked rosette at about 237 GDD, early bud at 410, late bud at 472 and early flower at 522. That year, the early-flower window ran roughly June 21-27.
- Check the forecast portion. Look ahead to see when the next stage is likely to arrive, so you can plan a few days in advance.
- Correct the staging if necessary. If what you see in the field doesn’t match the model, adjust the stage date to your observation. The model then recalibrates from there, giving you field-level timing.
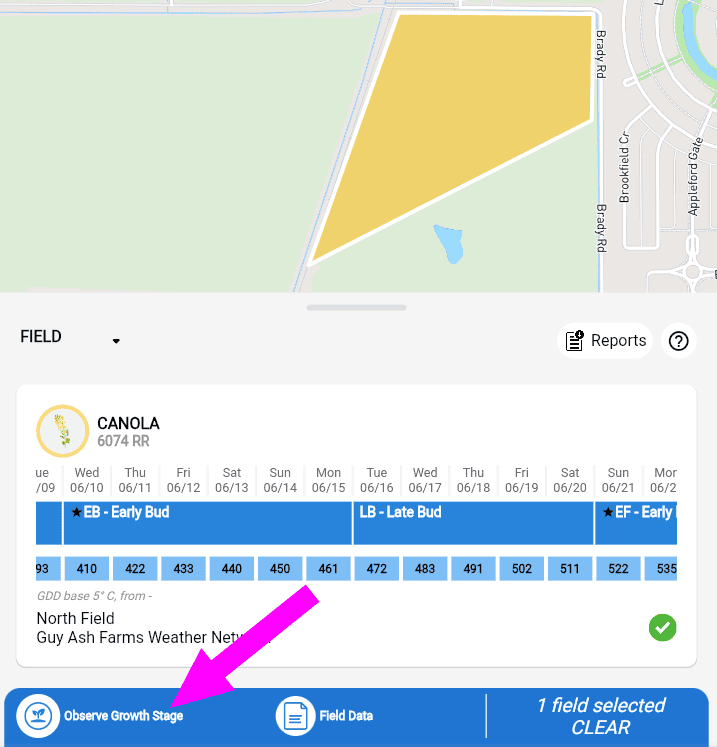
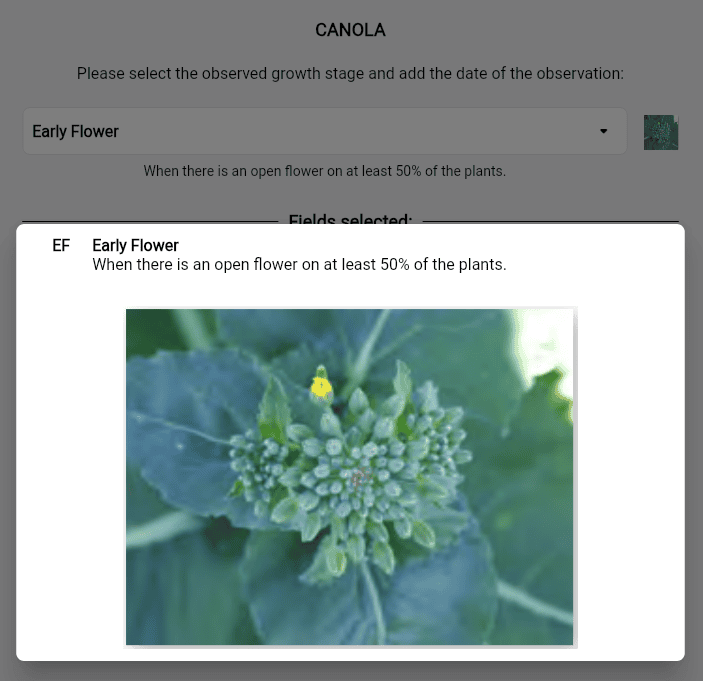
- Use the reference photos. Each stage has photos to help confirm what you’re seeing, which is useful if you’re less familiar with canola staging.
- Repeat for every field. Each field gets its own model for whatever is planted that year. With 50 fields, you’ll have 50 separate staging models.
What you can time with it
Once you know where each field is, GDD support a range of decisions:
- Fungicide timing. Sclerotinia stem rot protection in canola is tied to flowering, and the window is short.
- Insect scouting and spraying. Know when emergence or a key life stage is coming.
- Herbicide applications. Many labels are tied to crop stage, not date.
- Maturity and harvest. Estimate when a crop will be ready based on the heat that season has actually delivered.
Always check product labels and your agronomist’s advice for your own field conditions.
The decision comes back to timing
Your crop runs on heat, not dates. Tracking growing degree days field by field, with data from your own field and a forecast on top, lets you see a short window coming instead of reacting once it’s open.
TerraVision360 builds a GDD staging model for every field from your seeding date, your station data and a site-specific forecast, so you can plan spraying and scouting days ahead.
Leave a Reply